Candlestick analysis in the Forex market
Candlestick analysis is one of the types of graphical price analysis in financial markets. In particular in Forex. The essence comes down to using Japanese candlesticks, assessing their combination with each other – that is, patterns.
Candlesticks as graphic units originated in medieval Japan, when one of the rice exchange merchants began to use them in trading. In the 20s they came to the West and became very popular.
Nowadays, Japanese candlestick analysis is one of the basic and most common. There are many reasons for this:
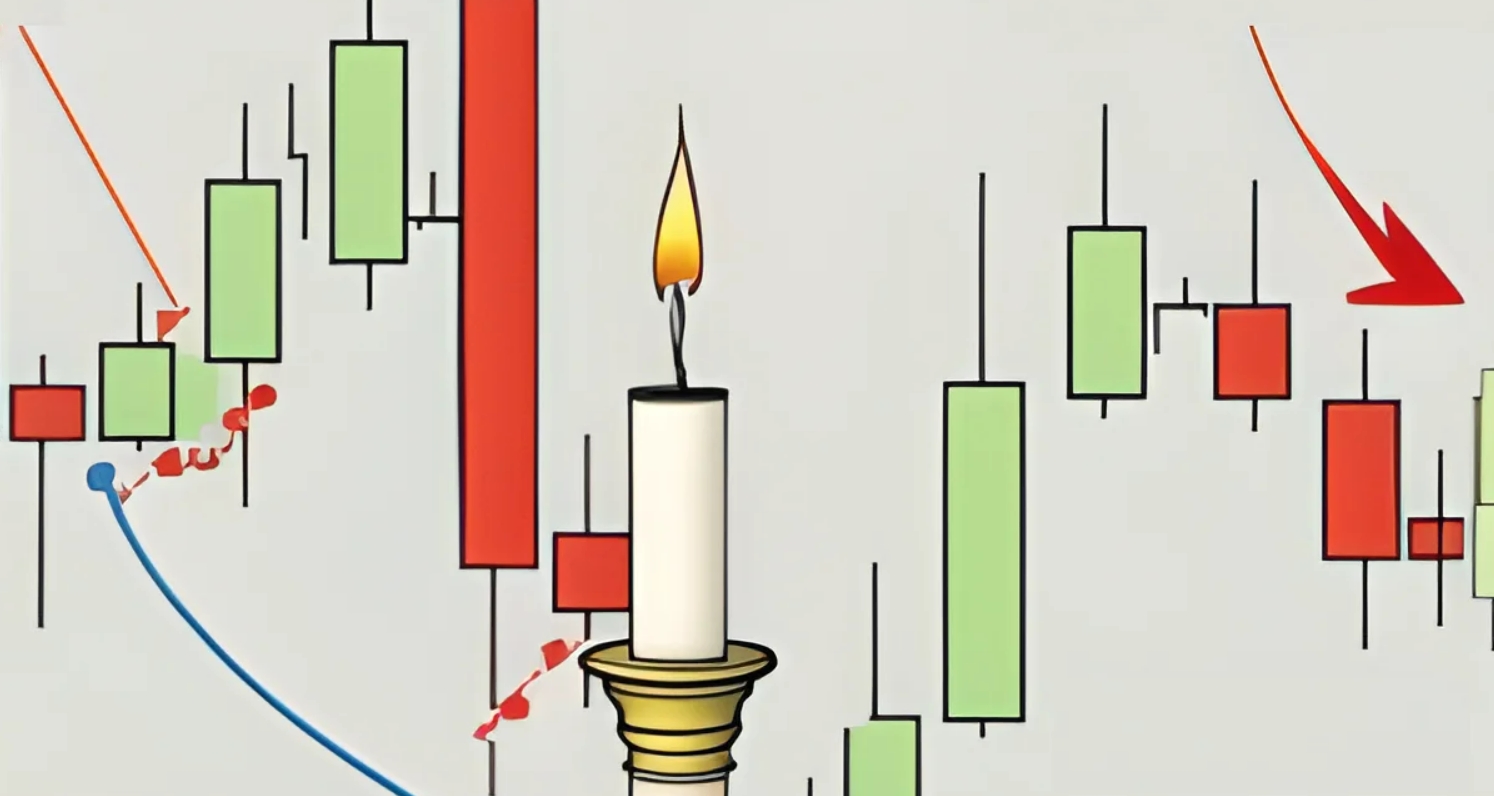
- Information content. A candlestick chart contains a lot of information – opening and closing prices, maximum and minimum quotes per tick.
- Visibility. The data is presented in a convenient form. The opening and closing prices form the body of the candle. Its color shows how the tick closed: above the entry or below. The upper and lower shadow (wicks below and above) show price extremes.
- High accuracy. The patterns are clear enough that they can be used to predict price movements in the near future. For example, such a characteristic feature as the absence of one of the shadows indicates a pronounced trend.
There are so-called candlestick patterns. They describe certain body and shadow parameters that make it possible to predict market movements. The most common models have names. You need to know them to make it easier to find patterns.
How to read Japanese candlesticks? What models are there?
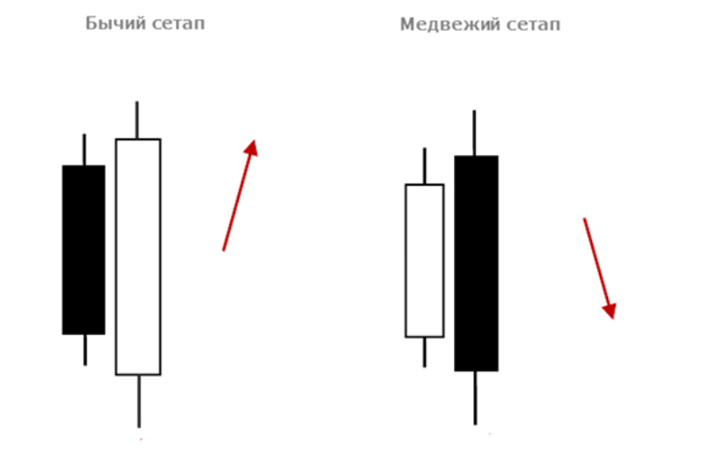
2 basic models of Japanese candlesticks – “bullish” and “bearish”. The first category includes those where the opening price is higher than the closing price. “Bearish” shows the opposite situation – when quotes have increased compared to the entry point.
What candles do you need to know in trading?
There are 7 popular candles:
- “Hammer”. Short body and long shadow towards support. The longer the shadow, the higher the likelihood of a downtrend reversal.
- “Falling star”. A short body and a long shadow towards the resistance level. Most often, a candle indicates that the upward trend has exhausted itself and a reversal is coming.
- “Top”. Small body, shadows of equal length. As a rule, it indicates a flat, but it can form on a pronounced trend, so you need to take into account neighboring candles.
- “Doji.” Model of a candle without a body. This indicates that the tick opened and closed at the same price. Moreover, the longer the shadow, the higher the likelihood of a trend forming.
- “Long-legged Doji.” One of the varieties of candles without a body. They are distinguished by the same or similar lengths of the upper and lower shadows. Such candles most often foreshadow a trend reversal. Especially if there was a gap in quotes before them.
- “Tombstone” Model without body. There is only one shadow. Most often, a candle indicates that the market direction will change.
- “Maribozu.” Model without shadow. This situation indicates a pronounced dominance of “bulls” or “bears” (depending on the color of the candle). With a high probability the price will move in the same direction.
It can be difficult to predict market movement on a single candlestick basis. That’s why there are candlestick patterns. They imply a combination of two or three candles with certain parameters.
Likbez Rating Forex: еThere are a lot of combinations. For the analysis to be more or less effective, you first need to know at least a dozen basic combinations.

Trading with candlestick patterns
The two simplest patterns are Double Top and Double Bottom. Their simplicity makes it easier to visually find patterns. To do this you need:
- Select the level of resistance (for a double top) or support (for a double bottom).
- Wait untilwill appear 3 candles. The 1st and 3rd ones test the level of resistance or support. The average touches the opposite level.
Typically, such a pattern is followed by breakdowns of support (if resistance was tested) or resistance (if support was tested).
“Absorption”
Another candlestick pattern is “Absorption”. It looks like two candles of different colors. The entry and exit points of the 1st are inside the 2nd. Candlestick analysis interprets this pattern in trading as a reversal towards the trend corresponding to the color of the 2nd candle.
For the pattern to work for sure, it is important to consider support and resistance levels. This will make it easier to filter out price noise.
Rating Forex reminds you: patterns are a subjective thing. People see them differently. Time frames also differ. This is why candles give such good results. If everyone had the same and accurate numbers, everyone would take into account trading patterns. Then they wouldn’t work.
“Clouds”
When there are two candles of different colors on the chart, with the right one going further along the trend, this pattern is called “Clouds”. It says that there is a high probability of a reversal from the next candle.
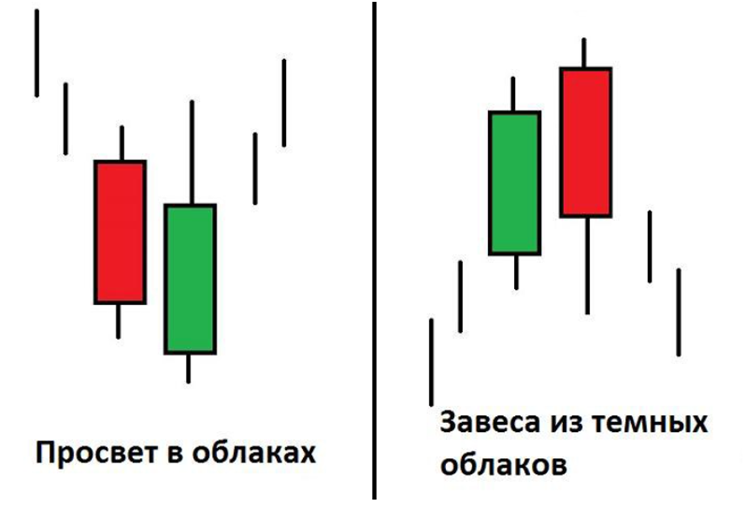
If a downward trend is reversing, you can place a buy order in the middle of the 2nd candle. If it is rising, it is for sale. This makes it possible to filter out false signals. If the price does not reach the selected entry point, most likely the trend will move in the same direction.
“Harami”
If a large candlestick in the color of the trend has formed on the chart, followed by a “Spinning Top”, this pattern is called “Harami”. Instead of “Top” there may be “Doji”. Then it will be a slightly different pattern – “Harami with a cross”.

It is important that the first candle absorbs the next one. This portends an imminent trend reversal. But most often “Harami” speaks of uncertainty. So it makes sense:
- Close a trade opened in the direction of the trend.
- Wait for further developments.
In the Harami pattern, the third candle is often tracked. Its color should be the opposite of the first. This suggests that the trend is highly likely to reverse.
“tweezers”
Candlestick patterns consisting of two or more candles that have the same body and start at the same level are called “Tweezers”. They indicate that there are strong price levels. When they are reached, the price usually reverses.

“Capture”
When there is a price gap in a strong trend chart followed by a candle of the opposite color, it is highly likely to be a Capture. It can be either “bullish” or “bearish”. It is important that the new candle covers most of the previous one with its closing level. Another feature of the pattern is that it opens from a gap.
The gap in this case means the difference between the closing and opening prices of the market. On Forex, it appears after the start of trading on the weekend. For exchange instruments – every day after the opening of the exchange.
Rating Forex reminds: a gap is a position of candles when one is higher or lower than the other, and their prices do not overlap. This may indicate technical failures or important events in the market.
In trading, Capture pattern candles only give a strong signal if the third candle has the same color as the second. That is, the opposite of the trend. This indicates that a pronounced market reversal is forming. If the third candle has a trendy color, the signal can be considered weak. In this case, it is better not to risk opening a transaction.
“Offensive”
If the chart shows 3 candlesticks arranged in a ladder and colored the same color, it is highly likely that this is an “Advance” pattern. He says: a strong trend has formed. Even the appearance of Doji cannot stop him.

Attention: the “Three Methods” pattern has exactly the same composition. He says that the market is undergoing a correction. When it is completed, the price movement will return to its previous direction.

The Offensive and Three Methods patterns can be distinguished by candle number 4. If it is a different color and has a body that almost completely overlaps the previous 3 candles, it is most likely a Three Methods pattern.
How many patterns are there for candlestick analysis?
If we talk only about the Forex market, the patterns listed above are considered the most common and frequent. There are many more of them in the stock market due to the gap. For example, there is a pattern with three daily candles of the same color. Each of them ends with a gap. He says the market is too overbought or oversold. The correction will begin soon.
Considering the stock market, there are about 50 most common patterns. Some are used in Forex.
It is very important to remember: graphs and analysis are very subjective. The combinations vary on different timeframes. This adds chaos to trading.
Nobody bothers you to identify your own patterns. Many pros have them. They are in no hurry to share their work. It is better for novice traders to understand those combinations of candles that have long been identified. They are united by simplicity and high accuracy. This means that the likelihood of incurring losses if interpreted correctly is much lower.


Related News

Withdrawing a token from Empires Battle bot (t.me/EmpiresBattleBot)
🆕️ News about withdrawing money from Empires Battle bot: how long to wait for […]
Read more
Withdrawing money from Bird Ton (t.me/BIRDTonBot)
🆕️ News about the withdrawal of a token from the Bird Ton crypto game: […]
Read more
Refund from Uniswap (uniswap.org)
🆕️ News about Uniswap exchange: reviews about withdrawing money, blocking crypto wallets 🔴 Be […]
Read more
How to get money back from Sushiswap (sushi.com)
🆕️ News about a hacker attack on Sushiswap: how to get money back from […]
Read more
Refund from TON Wallet Telegram (ton.org)
🆕️ News about the TON wallet in Telegram: reviews of money theft, how to […]
Read more
Refund from METAMaSK (metamask.io)
📤 Ways to withdraw money from METAMaSK: customer reviews and real stories, problem solving […]
Read more